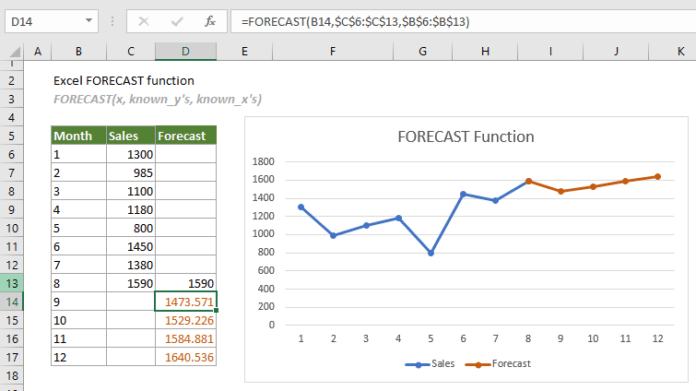
As businesses look for ways to optimize their demand planning, many are turning to Excel for its powerful forecasting capabilities. Excel allows businesses to analyze historical data, identify trends, and make informed predictions. However, with so many functions and features available, it can be overwhelming to know where to start.
In this article, we’ll provide you with tips and tricks for using Excel for forecasting that will help you make accurate predictions and stay ahead of the competition.
5 Tips and Tricks to Accurate Predictions Using Excel for Forecasting
To accurately predict or forecast demand planning, you can use Excel using the following tips:
Tip #1: Clean and Organize Your Data
Before you start forecasting, it’s important to ensure that your data is clean and well-organized. This means removing any duplicate entries, correcting any errors, and ensuring that all data is in the correct format. You should also consider grouping your data by month, quarter, or year, depending on the level of detail you need for your forecasts. By cleaning and organizing your data, you’ll ensure that your forecasts are based on accurate and reliable information.
Tip #2: Choose the Right Forecasting Technique
Excel offers a wide range of forecasting techniques, each with its strengths and weaknesses. Some techniques are better suited for businesses with stable demand patterns, while others are more effective for businesses with seasonal demand patterns. It’s important to choose the right forecasting technique based on your business needs and the nature of your data. Some of the most popular forecasting techniques in Excel include Moving Average, Exponential Smoothing, Trend Analysis, Regression Analysis, and Seasonal Decomposition.
Tip #3: Use Visualizations to Analyze Your Data
Excel offers a wide range of visualization tools that can help you analyze your data and identify trends. By using charts and graphs, you can quickly identify patterns and changes in demand over time. Some of the most popular visualization tools in Excel include Line Charts, Bar Charts, and Scatter Plots. By using these tools, you can gain a better understanding of your data and make more informed predictions.
Tip #4: Use What-If Analysis to Test Scenarios
What-If Analysis is a powerful tool in Excel that allows you to test different scenarios and see how they would impact your forecasts. For example, you can use What-If Analysis to test how changes in price, marketing spend, or external economic factors would impact your sales. By using this tool, you can identify potential risks and opportunities and adjust your forecasts accordingly.
Tip #5: Use Historical Error Analysis to Improve Accuracy
Finally, it’s important to regularly review your forecasts and compare them to actual results. By analyzing the historical errors in your forecasts, you can identify areas where your predictions were inaccurate and adjust your forecasting techniques accordingly. This process, known as Historical Error Analysis, can help you continuously improve the accuracy of your forecasts and stay ahead of the competition.
In conclusion, Forecast Excel offers a wide range of powerful tools and techniques for demand planning and forecasting. By cleaning and organizing your data, choosing the right forecasting technique, using visualizations to analyze your data, using What-If Analysis to test scenarios, and using Historical Error Analysis to improve accuracy, you can make more informed predictions and stay ahead of the competition. So why wait? Start using Excel for forecasting today and take your business to the next level.

